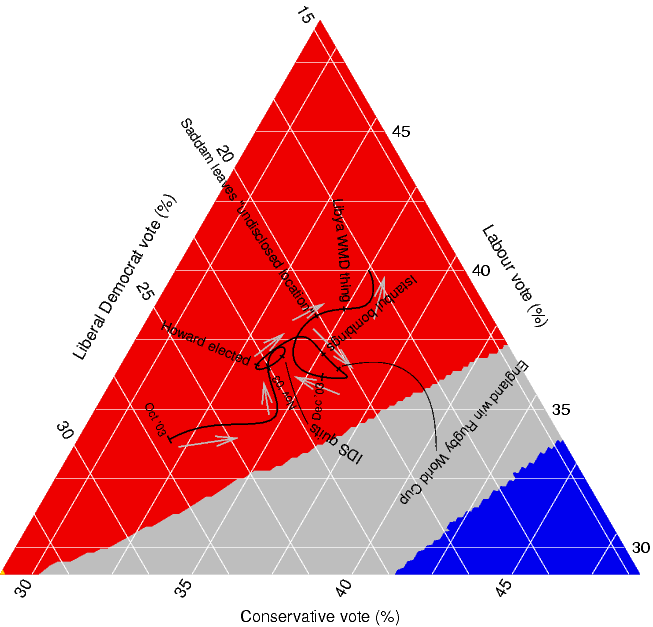
Also known as the Ternary Plot, the Triangular Plot is a graphical representation of three variables as positions in an equilateral triangle. The proportions of the variables always total to some constant (a + b + c = K). Any one variable is not independent of the others, so only two variables must be known. Although most triangular plots are seen in physical sciences such as geology, the creator of this plot used the chart to visually represent the probable outcome of an election based on recent (at the time) opinion polls.