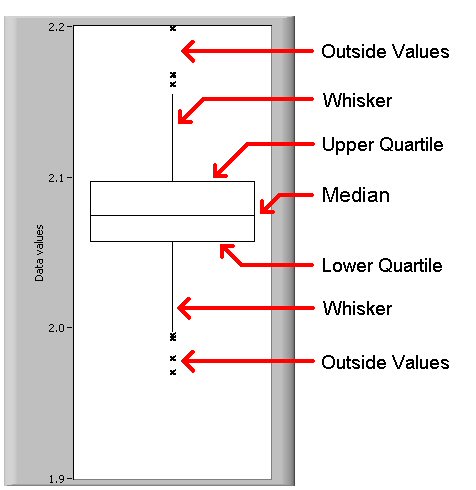
This is a Box Plot graph that shows all the elements of this particular type of graph. A Box Plot is a graphical depiction of numerical data. The data is split into 5 groups: (1) the smallest observation (or the sample minimum), (2) the lower quartile, (3) the median, (4) the upper quartile, and (5) the largest observation (or the sample maximum). As this example demonstrates, a Box Plot can also show outliers (or outside values). Box plots can be horizontally or vertically oriented and can be displayed side by side to show variations of data.
No comments:
New comments are not allowed.